Multi-dataset: Motif Enrichment Analysis
This example demonstrates how to discover enriched spatial motifs across multiple fields of view (FOVs) and compare motif patterns between conditions using spatial_query_multi.
When you have multiple tissue sections or experimental conditions, spatial_query_multi pools information across FOVs to provide condition-level motif enrichment results. You can also run enrichment per condition to compare spatial organization patterns.
Dataset: CODEX spatial proteomics from colorectal cancer — CLR (Crohn’s-Like Reaction) vs DII (Diffuse Inflammatory Infiltration) immune subtypes Key API: spatial_query_multi.motif_enrichment_dist and spatial_query_multi.motif_enrichment_knn
Setup
[1]:
import warnings
warnings.filterwarnings("ignore")

import anndata as ad
import numpy as np
import pandas as pd
import matplotlib.pyplot as plt
import seaborn as sns

from SpatialQuery import spatial_query_multi
Load Data & Initialize
[3]:
DATA_DIR = "../data/codex_cancer"

adata = ad.read_h5ad(f"{DATA_DIR}/codex_data.h5ad")

# Assign immune subtype labels
adata.obs["state"] = "CLR"
adata.obs["state"][adata.obs["groups"] == 2] = "DII"

print(f'Max value: {adata.X.max()}')
adata
Max value: 54776.6953125
[3]:
AnnData object with n_obs × n_vars = 258385 × 56
    obs: 'CellID', 'ClusterID', 'EventID', 'File Name', 'Region', 'TMA_AB', 'TMA_12', 'Index in File', 'groups', 'patients', 'spots', 'cell_id', 'size:size', 'HOECHST1_Cyc_1_ch_1', 'DRAQ5_Cyc_23_ch_4', 'Profile_Homogeneity:Fiter1', 'ClusterSize', 'ClusterName', 'neighborhood10', 'CD4+ICOS+', 'CD4+Ki67+', 'CD4+PD-1+', 'CD68+CD163+ICOS+', 'CD68+CD163+Ki67+', 'CD68+CD163+PD-1+', 'CD68+ICOS+', 'CD68+Ki67+', 'CD68+PD-1+', 'CD8+ICOS+', 'CD8+Ki67+', 'CD8+PD-1+', 'Treg-ICOS+', 'Treg-Ki67+', 'Treg-PD-1+', 'neighborhood number final', 'neighborhood name', 'state'
    var: 'marker_name', 'full_name', 'cell_type_annotation', 'cycle', 'channel'
    uns: 'data_source', 'groups_mapping', 'n_markers', 'technology'
    obsm: 'X_spatial_global', 'X_spatial_tile'
Inspect adata.obsm for spatial coordinates, adata.obs for cell type labels and FOV identifiers, and adata.var for feature names. Then set the corresponding column names below. This data need to be normalized. For the spatial proteomics data, we perform feature-wise z-score normalization.
[4]:
# Feature-wise z-score normalization for protein expression
adata.X = (adata.X - adata.X.mean(axis=0)) / adata.X.std(axis=0)
[5]:
spatial_key = "X_spatial_tile"
label_key = "ClusterName"
feature_name = "marker_name"
fov_key = "File Name"
[6]:
# Split data by FOV and immune subtype
clr_data = adata[adata.obs["state"] == "CLR"]
dii_data = adata[adata.obs["state"] == "DII"]

clr_datas = [clr_data[clr_data.obs[fov_key] == f] for f in clr_data.obs[fov_key].unique()]
dii_datas = [dii_data[dii_data.obs[fov_key] == f] for f in dii_data.obs[fov_key].unique()]

ds_names = ["CLR"] * len(clr_datas) + ["DII"] * len(dii_datas)
adata_fovs = clr_datas + dii_datas

print(f"CLR FOVs: {len(clr_datas)}, DII FOVs: {len(dii_datas)}")
CLR FOVs: 68, DII FOVs: 72
[7]:
spm = spatial_query_multi(
    adatas=adata_fovs,
    datasets=ds_names,
    spatial_key=spatial_key,
    label_key=label_key,
    feature_name=feature_name,
    build_gene_index=False,
    if_lognorm=False,  # data is already z-score normalized
    if_normalize_spatial_coord=True,
)
Auto-normalizing spatial coordinates: mean nearest neighbor distance = 1.0
Scale factor: 0.0448
build_gene_index is False. Using adata.X for gene expression analysis.

Auto-normalizing spatial coordinates: mean nearest neighbor distance = 1.0
Scale factor: 0.0311
build_gene_index is False. Using adata.X for gene expression analysis.

Auto-normalizing spatial coordinates: mean nearest neighbor distance = 1.0
... (548 lines omitted) ...
Scale factor: 0.0421
build_gene_index is False. Using adata.X for gene expression analysis.
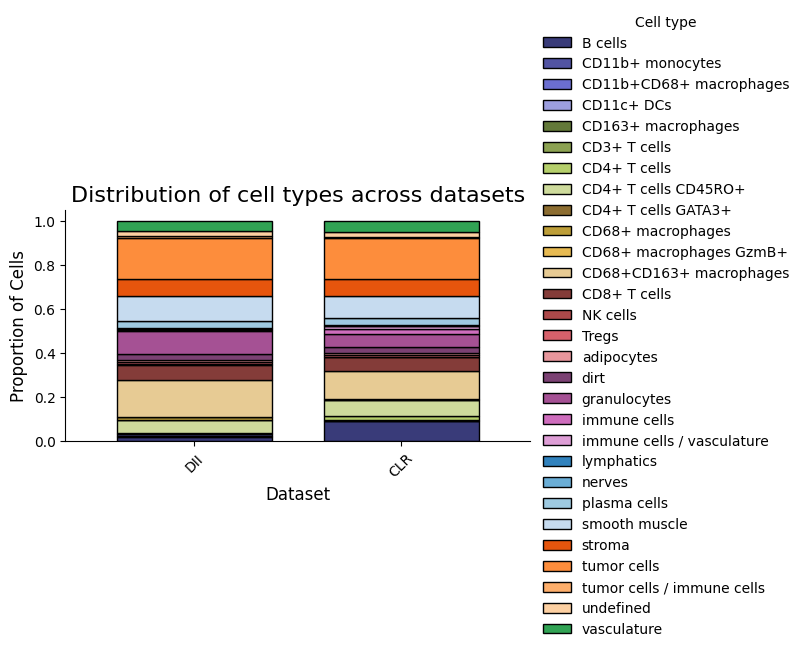
Cell Type Composition
Before motif analysis, inspect the cell type composition across conditions to ensure sufficient representation of the anchor cell type.
[8]:
from matplotlib.colors import ListedColormap
import matplotlib.cm as cm

# More than 20 cell types, need to customize colors to avoid repeats in tab20. Otherwise, just call spm.plot_cell_type_distribution()
# Combine tab20b + tab20c for 40 unique colors (needed when >20 cell types)
all_colors = []
for name in ["tab20b", "tab20c"]:
    cmap = cm.get_cmap(name)
    all_colors.extend([cmap(i) for i in range(cmap.N)])

seen = set()
unique_colors = []
for c in all_colors:
    key = tuple(round(v, 4) for v in c)
    if key not in seen:
        seen.add(key)
        unique_colors.append(c)

custom_cmap = ListedColormap(unique_colors, name="tab40")

spm.plot_cell_type_distribution(colormap=custom_cmap)
/var/folders/wl/y90xsxr94l78931lqz6nyvz80000gp/T/ipykernel_52641/2336141135.py:8: MatplotlibDeprecationWarning: The get_cmap function was deprecated in Matplotlib 3.7 and will be removed in 3.11. Use ``matplotlib.colormaps[name]`` or ``matplotlib.colormaps.get_cmap()`` or ``pyplot.get_cmap()`` instead.
  cmap = cm.get_cmap(name)
/var/folders/wl/y90xsxr94l78931lqz6nyvz80000gp/T/ipykernel_52641/2336141135.py:8: MatplotlibDeprecationWarning: The get_cmap function was deprecated in Matplotlib 3.7 and will be removed in 3.11. Use ``matplotlib.colormaps[name]`` or ``matplotlib.colormaps.get_cmap()`` or ``pyplot.get_cmap()`` instead.
  cmap = cm.get_cmap(name)
/Users/sa3520/BWH/spatial query/python/SpatialQuery/spatial_query_multiple_fov.py:1441: MatplotlibDeprecationWarning: The get_cmap function was deprecated in Matplotlib 3.7 and will be removed in 3.11. Use ``matplotlib.colormaps[name]`` or ``matplotlib.colormaps.get_cmap()`` or ``pyplot.get_cmap()`` instead.
  cmap = cm.get_cmap(colormap)
Distance-based Motif Enrichment Per Condition
motif_enrichment_dist discovers enriched spatial motifs using radius-based neighborhoods. If no motifs are specified, it first mines frequent cell type patterns around the anchor cell type, then tests each pattern for statistical enrichment using a hypergeometric test.
Run it separately for each condition by passing the dataset parameter. This pools all FOVs within that condition and reports enriched motifs.
Key parameters:
Parameter |
Description |
|---|---|
|
Anchor cell type to analyze neighborhoods around |
|
Specific motif(s) to test. If |
|
Condition name(s) to restrict the analysis to. If |
|
Maximum distance (radius) for considering a cell as a neighbor |
|
Minimum neighborhood size for each anchor cell to be included |
|
Minimum frequency threshold for a pattern to be considered frequent (0–1) |
|
If |
Key output columns:
Column |
Description |
|---|---|
|
Anchor cell type |
|
List of cell types in the motif |
|
Number of anchor cells with the motif in their neighborhood |
|
Total number of anchor cells |
|
Total number of cells belonging to the motif cell types |
|
Expected count under the hypergeometric null |
|
P-value from hypergeometric test |
|
FDR-corrected p-value (when multiple motifs tested) |
|
Whether the enrichment is statistically significant |
[9]:
anchor_ct = "B cells"
max_dist = 5
min_support = 0.5
clr = "CLR"
dii = "DII"

enrich_per_condition = {}
for ds in [clr, dii]:
    result = spm.motif_enrichment_dist(
        ct=anchor_ct,
        dataset=ds,
        max_dist=max_dist,
        min_support=min_support,
    )
    enrich_per_condition[ds] = result[result["if_significant"]]
    print(f"{ds}: {len(enrich_per_condition[ds])} enriched motifs")
CLR: 2 enriched motifs
DII: 14 enriched motifs
[10]:
# Combine results for side-by-side comparison
enrich_all = pd.DataFrame()
for ds, df in enrich_per_condition.items():
    df = df.copy()
    df["dataset"] = ds
    enrich_all = pd.concat([enrich_all, df], axis=0)

enrich_all.reset_index(drop=True, inplace=True)
enrich_all
[10]:
| center | motifs | n_center_motif | n_center | n_motif | expectation | p-values | adj-pval | if_significant | dataset | |
|---|---|---|---|---|---|---|---|---|---|---|
| 0 | B cells | [B cells, CD4+ T cells CD45RO+, CD8+ T cells] | 6680 | 10269 | 27291 | 2523.399564 | 0.000000e+00 | 0.000000e+00 | True | CLR |
| 1 | B cells | [B cells, tumor cells] | 5382 | 10269 | 24255 | 2242.682805 | 0.000000e+00 | 0.000000e+00 | True | CLR |
| 2 | B cells | [B cells, CD8+ T cells] | 1704 | 2774 | 26742 | 503.531726 | 0.000000e+00 | 0.000000e+00 | True | DII |
| 3 | B cells | [B cells, CD4+ T cells CD45RO+] | 1647 | 2774 | 24170 | 455.102902 | 0.000000e+00 | 0.000000e+00 | True | DII |
| 4 | B cells | [B cells, stroma] | 1592 | 2774 | 26083 | 491.123252 | 0.000000e+00 | 0.000000e+00 | True | DII |
| 5 | B cells | [B cells, CD68+CD163+ macrophages] | 1495 | 2774 | 30610 | 576.363254 | 0.000000e+00 | 0.000000e+00 | True | DII |
| 6 | B cells | [B cells, smooth muscle] | 1425 | 2774 | 19963 | 375.888260 | 0.000000e+00 | 0.000000e+00 | True | DII |
| 7 | B cells | [CD4+ T cells CD45RO+, CD8+ T cells] | 1668 | 2774 | 58370 | 1099.063153 | 1.527325e-107 | 3.818311e-107 | True | DII |
| 8 | B cells | [CD8+ T cells, smooth muscle] | 1393 | 2774 | 47767 | 899.416646 | 1.183362e-85 | 2.535775e-85 | True | DII |
| 9 | B cells | [CD4+ T cells CD45RO+, stroma] | 1566 | 2774 | 57711 | 1086.654679 | 3.314561e-77 | 6.214802e-77 | True | DII |
| 10 | B cells | [CD8+ T cells, stroma] | 1655 | 2774 | 64677 | 1217.819215 | 7.365512e-64 | 1.227585e-63 | True | DII |
| 11 | B cells | [vasculature] | 1641 | 2774 | 66663 | 1255.214100 | 3.938264e-50 | 5.907396e-50 | True | DII |
| 12 | B cells | [CD8+ T cells, tumor cells] | 1447 | 2774 | 61444 | 1156.944259 | 1.881974e-29 | 2.566328e-29 | True | DII |
| 13 | B cells | [CD4+ T cells CD45RO+, CD68+CD163+ macrophages] | 1557 | 2774 | 70499 | 1327.443091 | 5.381246e-19 | 6.726557e-19 | True | DII |
| 14 | B cells | [CD68+CD163+ macrophages, CD8+ T cells] | 1709 | 2774 | 82157 | 1546.954454 | 1.412683e-10 | 1.630019e-10 | True | DII |
| 15 | B cells | [stroma, tumor cells] | 1419 | 2774 | 69652 | 1311.494719 | 1.712935e-05 | 1.835287e-05 | True | DII |
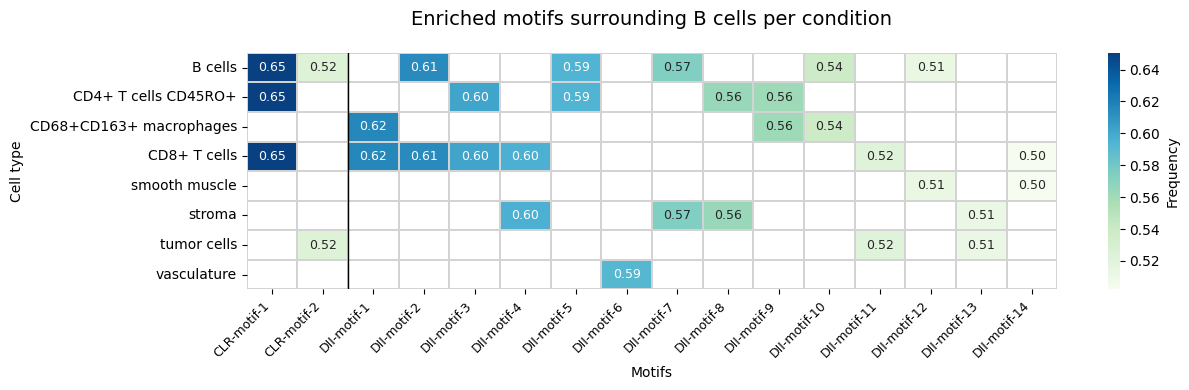
Visualize Motif Enrichment Heatmap
Build a heatmap comparing enriched motifs across conditions. Each column is a motif (labeled by condition), each row is a cell type, and the color shows the frequency (fraction of anchor cells containing that motif).
[11]:
enrich = enrich_all.copy()
enrich["frequency"] = enrich["n_center_motif"] / enrich["n_center"]

# Sort and label motifs
enrich = enrich.sort_values(by=["dataset", "frequency"], ascending=[True, False]).reset_index(drop=True)
enrich["motif_num"] = enrich.groupby("dataset").cumcount() + 1
enrich["motif_group"] = enrich["dataset"] + "_motif_" + enrich["motif_num"].astype(str)

# Build heatmap
enrich_expanded = enrich.explode("motifs")
heatmap_data = enrich_expanded.pivot_table(
    index="motifs", columns="motif_group", values="frequency", aggfunc="first",
)
col_order = enrich["motif_group"].tolist()
heatmap_data = heatmap_data[col_order]
heatmap_data.columns = [c.replace("_", "-") for c in heatmap_data.columns]

# Reorder by condition
col_reordered = []
for ds in [clr, dii]:
    col_reordered.extend([c for c in heatmap_data.columns if c.startswith(ds)])
heatmap_data = heatmap_data[col_reordered]

# Find condition boundaries
boundaries = []
prev = None
for i, c in enumerate(col_reordered):
    cur = c.split("-motif")[0]
    if prev and cur != prev:
        boundaries.append(i)
    prev = cur

fig, ax = plt.subplots(figsize=(max(8, len(col_reordered) * 0.8), max(4, len(heatmap_data) * 0.45)))
sns.heatmap(
    heatmap_data, cmap="GnBu", linewidths=0.1, linecolor="lightgrey",
    annot=True, fmt=".2f", annot_kws={"fontsize": 9},
    cbar_kws={"label": "Frequency"}, ax=ax,
)
for b in boundaries:
    ax.axvline(x=b, color="black", linewidth=1)

plt.title(f"Enriched motifs surrounding {anchor_ct} per condition", fontsize=14, pad=20)
plt.ylabel("Cell type")
plt.xlabel("Motifs")
plt.xticks(rotation=45, ha="right", fontsize=9)
plt.tight_layout()
plt.show()
KNN-based Motif Enrichment
motif_enrichment_knn defines neighborhoods by the k nearest neighbors rather than a fixed radius. This is useful when cell density varies across FOVs. The statistical test and output format are the same as the distance-based version.
Key parameters:
Parameter |
Description |
|---|---|
|
Anchor cell type to analyze neighborhoods around |
|
Specific motif(s) to test. If |
|
Condition name(s) to restrict the analysis to. If |
|
Number of nearest neighbors to define the neighborhood |
|
Minimum frequency threshold for a pattern to be considered frequent (0–1) |
|
Maximum distance cutoff for neighbors (filters out distant KNN) |
|
If |
[12]:
k = 50

enrich_knn_per_condition = {}
for ds in [clr, dii]:
    result = spm.motif_enrichment_knn(
        ct=anchor_ct,
        dataset=ds,
        k=k,
        min_support=min_support,
    )
    enrich_knn_per_condition[ds] = result[result["if_significant"]]
    print(f"{ds} (KNN): {len(enrich_knn_per_condition[ds])} enriched motifs")
CLR (KNN): 4 enriched motifs
DII (KNN): 20 enriched motifs
[13]:
enrich_knn_per_condition[clr]
[13]:
| center | motifs | n_center_motif | n_center | n_motif | expectation | p-values | adj-pval | if_significant | |
|---|---|---|---|---|---|---|---|---|---|
| 0 | B cells | [B cells, CD4+ T cells CD45RO+, CD8+ T cells] | 7346 | 10269 | 38089 | 3521.811806 | 0.0 | 0.0 | True |
| 1 | B cells | [B cells, CD4+ T cells CD45RO+, tumor cells] | 5583 | 10269 | 31014 | 2867.638199 | 0.0 | 0.0 | True |
| 2 | B cells | [B cells, CD68+CD163+ macrophages] | 5533 | 10269 | 38564 | 3565.731589 | 0.0 | 0.0 | True |
| 3 | B cells | [B cells, stroma] | 5405 | 10269 | 35723 | 3303.045056 | 0.0 | 0.0 | True |
[14]:
enrich_knn_per_condition[dii]
[14]:
| center | motifs | n_center_motif | n_center | n_motif | expectation | p-values | adj-pval | if_significant | |
|---|---|---|---|---|---|---|---|---|---|
| 0 | B cells | [B cells, CD8+ T cells, smooth muscle] | 1442 | 2774 | 28123 | 529.534916 | 0.000000e+00 | 0.000000e+00 | True |
| 1 | B cells | [B cells, CD4+ T cells CD45RO+, smooth muscle] | 1401 | 2774 | 26189 | 493.119152 | 0.000000e+00 | 0.000000e+00 | True |
| 2 | B cells | [B cells, CD4+ T cells CD45RO+, tumor cells] | 1481 | 2774 | 30756 | 579.112324 | 0.000000e+00 | 0.000000e+00 | True |
| 3 | B cells | [B cells, CD8+ T cells, tumor cells] | 1534 | 2774 | 33064 | 622.570226 | 2.539186e-314 | 1.777430e-313 | True |
| 4 | B cells | [B cells, CD8+ T cells, vasculature] | 1435 | 2774 | 30545 | 575.139353 | 3.203226e-291 | 1.793807e-290 | True |
| 5 | B cells | [B cells, CD4+ T cells CD45RO+, CD8+ T cells, ... | 1450 | 2774 | 31278 | 588.941191 | 4.633437e-289 | 2.162271e-288 | True |
| 6 | B cells | [B cells, stroma, tumor cells] | 1439 | 2774 | 33015 | 621.647593 | 2.032194e-256 | 8.128774e-256 | True |
| 7 | B cells | [B cells, CD4+ T cells CD45RO+, CD68+CD163+ ma... | 1397 | 2774 | 34549 | 650.531658 | 2.785379e-212 | 9.748827e-212 | True |
| 8 | B cells | [B cells, CD68+CD163+ macrophages, stroma] | 1471 | 2774 | 40034 | 753.810078 | 9.819875e-186 | 3.055072e-185 | True |
| 9 | B cells | [CD4+ T cells CD45RO+, CD8+ T cells, vasculature] | 1496 | 2774 | 56576 | 1065.283484 | 4.428276e-63 | 1.239917e-62 | True |
| 10 | B cells | [CD4+ T cells CD45RO+, CD8+ T cells, smooth mu... | 1433 | 2774 | 53586 | 1008.984035 | 5.461725e-62 | 1.390257e-61 | True |
| 11 | B cells | [CD4+ T cells CD45RO+, CD8+ T cells, tumor cells] | 1589 | 2774 | 67236 | 1266.003258 | 9.970222e-36 | 2.326385e-35 | True |
| 12 | B cells | [CD4+ T cells CD45RO+, stroma, vasculature] | 1406 | 2774 | 58943 | 1109.852312 | 7.727838e-31 | 1.664457e-30 | True |
| 13 | B cells | [CD8+ T cells, stroma, vasculature] | 1455 | 2774 | 63432 | 1194.376802 | 4.531092e-24 | 9.062183e-24 | True |
| 14 | B cells | [CD8+ T cells, smooth muscle, stroma] | 1403 | 2774 | 60796 | 1144.742907 | 7.966853e-24 | 1.487146e-23 | True |
| 15 | B cells | [CD4+ T cells CD45RO+, stroma, tumor cells] | 1506 | 2774 | 69103 | 1301.157462 | 1.666807e-15 | 2.916912e-15 | True |
| 16 | B cells | [CD8+ T cells, stroma, tumor cells] | 1587 | 2774 | 76752 | 1445.182374 | 2.215603e-08 | 3.649229e-08 | True |
| 17 | B cells | [CD68+CD163+ macrophages, CD8+ T cells, vascul... | 1456 | 2774 | 70189 | 1321.606025 | 1.149329e-07 | 1.787845e-07 | True |
| 18 | B cells | [tumor cells, vasculature] | 1485 | 2774 | 71852 | 1352.919063 | 1.847543e-07 | 2.722696e-07 | True |
| 19 | B cells | [CD4+ T cells CD45RO+, CD68+CD163+ macrophages... | 1461 | 2774 | 70739 | 1331.962111 | 3.391530e-07 | 4.748142e-07 | True |
Targeted Motif Enrichment
Test a specific motif hypothesis across conditions. Here we test a TLS-associated motif.
[15]:
motif_tls = ["B cells", "CD4+ T cells", "CD4+ T cells CD45RO+", "CD8+ T cells"]

result_clr = spm.motif_enrichment_dist(
    ct=anchor_ct,
    motifs=motif_tls,
    dataset=clr,
    max_dist=max_dist,
)
result_clr
[15]:
| center | motifs | n_center_motif | n_center | n_motif | expectation | p-values | if_significant | |
|---|---|---|---|---|---|---|---|---|
| 0 | B cells | [B cells, CD4+ T cells, CD4+ T cells CD45RO+, ... | 3225 | 10269 | 11385 | 1052.687847 | 0.0 | True |
[16]:
motif_tls = ["B cells", "CD4+ T cells", "CD4+ T cells CD45RO+", "CD8+ T cells"]

result_dii = spm.motif_enrichment_dist(
    ct=anchor_ct,
    motifs=motif_tls,
    dataset=dii,
    max_dist=max_dist,
)
result_dii
[16]:
| center | motifs | n_center_motif | n_center | n_motif | expectation | p-values | if_significant | |
|---|---|---|---|---|---|---|---|---|
| 0 | B cells | [B cells, CD4+ T cells, CD4+ T cells CD45RO+, ... | 249 | 2774 | 3063 | 57.673984 | 1.012861e-83 | True |